Watch FairPlay's latest on demand webinar: How to Choose a Less Discriminatory Alternative
Watch Now!

The State of U.S. Mortgage Fairness
A FairPlayTM Report

A comprehensive study of more than 350 million mortgage applications from 1990 to 2021.
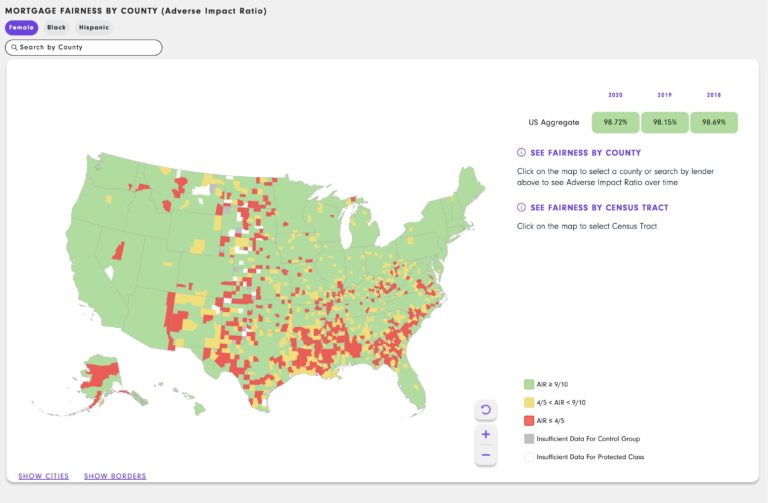
Interactive U.S. map showing mortgage fairness by county.

Download FairPlay’s Mortgage Fairness Monitor

Get 5 Fact Sheets highlighting the state of mortgage fairness for Female, Black, Hispanic, Millennial, and Baby Boomer applicants.

Mortgage Fairness for Black Homebuyers in 2020

Nationally, Black homebuyers were approved at 78% the rate of White homebuyers.
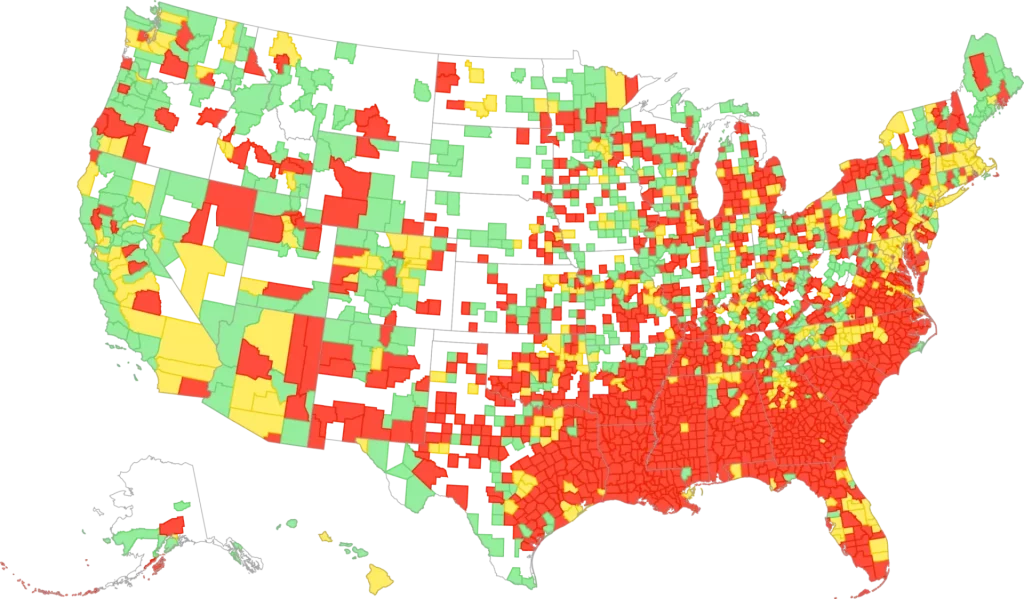
Color-coded U.S. map showing regional data distribution

Mortgage Fairness for Hispanic Homebuyers in 2020

Nationally, Hispanic homebuyers were approved at 87% the rate of White homebuyers.
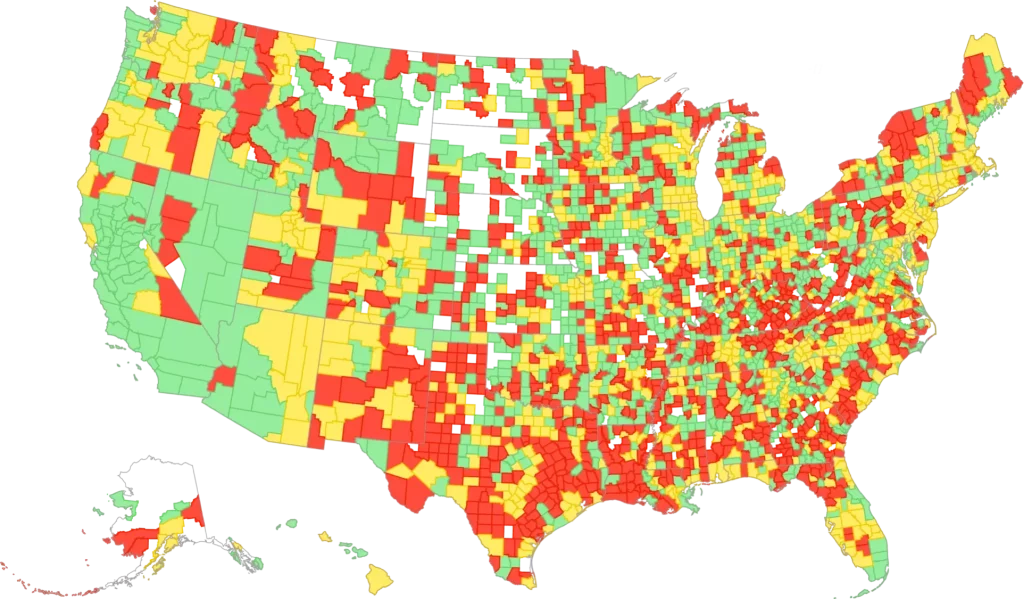
Color-coded map of US counties

Mortgage Fairness for Female Homebuyers in 2020

Nationally, Female homebuyers were approved at 98% the rate of White homebuyers.
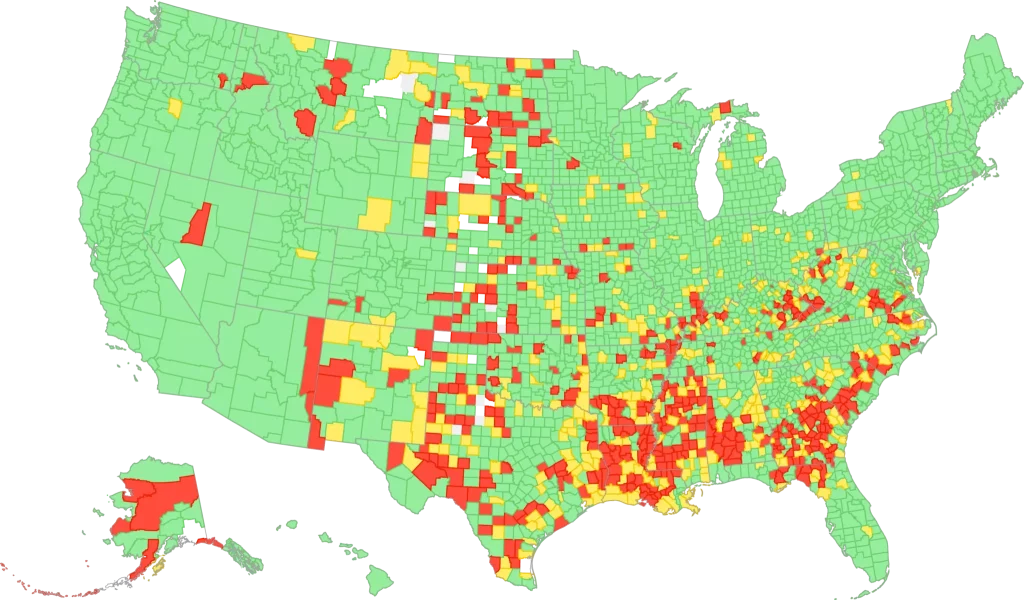
Color-coded map showing U.S. regional data distribution.

Mortgage Fairness for Baby Boomer Homebuyers in 2020

Nationally, Baby Boomers had a slightly lower approval rate relative to Gen X homebuyers.
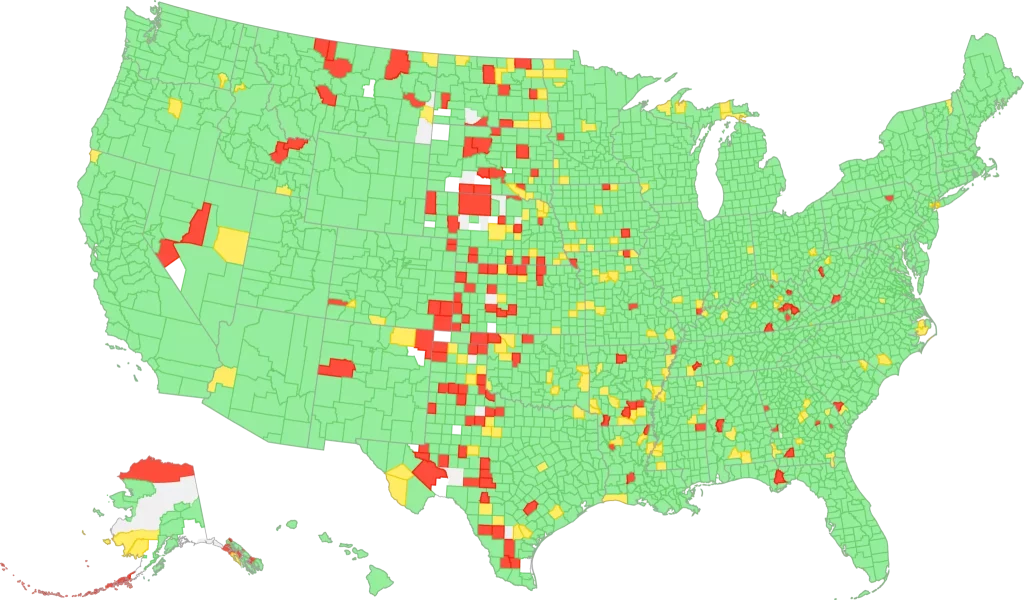
Color-coded map showing US regional data variability.

Mortgage Fairness for Millennial Homebuyers in 2020

Nationally, Millennial homebuyers had the same approval rate as Gen X homebuyers.
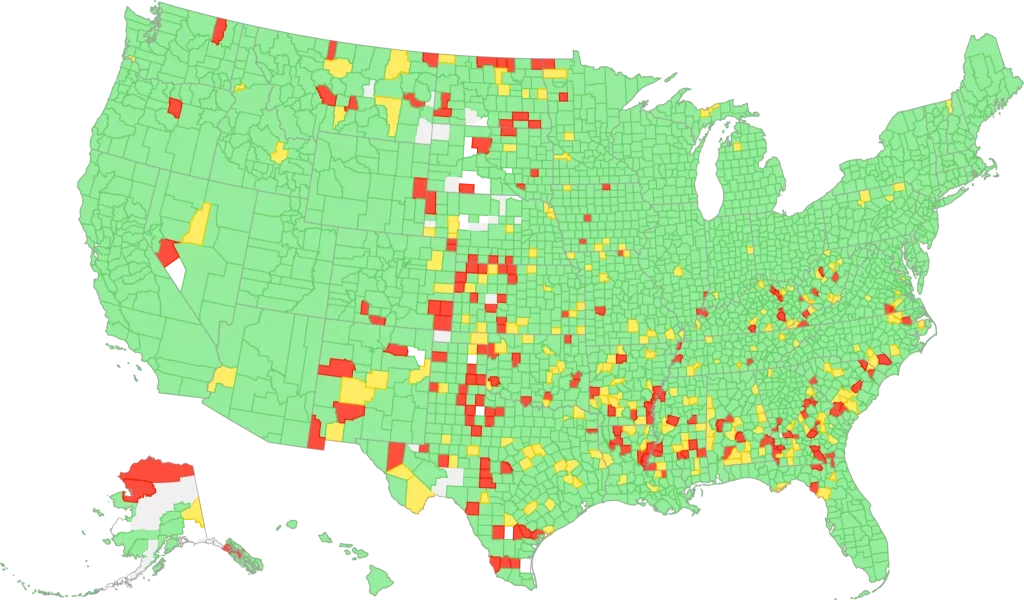
Color-coded U.S. map showing varied regional data

Mortgage Fairness for Black Homebuyers in 2020

Nationally, Black homebuyers were approved at 78% the rate of White homebuyers.

Color-coded U.S. map showing regional data distribution

Mortgage Fairness for Hispanic Homebuyers in 2020

Nationally, Hispanic homebuyers were approved at 87% the rate of White homebuyers.

Color-coded map of US counties

Mortgage Fairness for Female Homebuyers in 2020

Nationally, Female homebuyers were approved at 98% the rate of White homebuyers.

Color-coded map showing U.S. regional data distribution.

Mortgage Fairness for Baby Boomer Homebuyers in 2020

Nationally, Baby Boomers had a slightly lower approval rate relative to Gen X homebuyers.

Color-coded map showing US regional data variability.

Mortgage Fairness for Millennial Homebuyers in 2020

Nationally, Millennial homebuyers had the same approval rate as Gen X homebuyers.

Color-coded U.S. map showing varied regional data

Mortgage Fairness Methodology

To compile these maps, FairPlayTM analyzed publicly available data for 2020 from the Home Mortgage Disclosure Act Database. We limited our review to applicants seeking to buy a new home, rather than applicants seeking to refinance or obtain a line of credit. Then we computed the Adverse Impact Ratio (AIR) for every county in the U.S. We also computed AIR values for 20 major metropolitan areas.
AIR is a measure of demographic parity; it does not control for risk.

Calculating the Adverse Impact Ratio

Adverse Impact Ratio is a calculation that regulators and courts use as a means of determining whether members of a protected class receive a certain outcome, such as getting approved for a loan, as often as a control group, such as white male borrowers, does.
Here is how AIR is calculated:
Graph comparing approval rates for protected vs control classes

Join us in building a fairer future.

Contact us to learn more and receive a customized fairness assessment at no cost.
GET A DEMO